Best practices for effective automation applications, Part 2: Automation case study
Two system integration thought leaders offer advice on effective automation communication. Part 2 details effective automation through a case study example involving a control system modification. Link to other parts.

Automation application insights
- A system integrator explained a control system modification and the challenges they faced during the project to make it work effectively within the confines of the facility and its environment.
- The biggest lesson learned from the project was initial design and investigation are key to success because they can prevent many potential headaches from occurring in the first place.
No matter the automation technologies being considered or applied, universal rules apply, including considering automation during process design. Whether just starting or a seasoned expert, heed this advice when applying automation. Automation can do quite a bit, but do not over-reach automation’s capabilities. Automation cannot cure overly complex operations. Get the right design first, then apply the right automation. Real-world examples will help fill skills gaps with smart manufacturing. This has been edited for clarity.
Control Engineering content manager, Mark T. Hoske, moderated the webcast “Best practices for effective automation applications.” The Aug. 16, 2022, course, archived as a webcast for a year, aims to answer the following questions about optimizing automation applications:
-
Assess the process or processes under consideration for automation.
-
Determine if a redesign is needed prior to automating.
-
Consider key ways automation can influence and enhance process design.
-
Identify steps for an automation implementation.
-
Examine lessons learned and best practices for effective automation applications.
Chris Clayton, advanced manufacturing engineer for Applied Manufacturing Technologies, and Kevin Tom, lead automation engineer E Tech Group, offer insights on automation effectiveness through their experiences and a case study example. This has been edited for clarity.
Process design can negatively impact ability to automate
Kevin Tom: There’s a thing that always comes to mind for me when I think of new plant construction. Automation always comes last. It’s only after everything else is put in place that the integrator is brought in to install and test the control system, so they’re often the last member of the team left on site. Integrators are often left to deal with tying up loose ends when things don’t work, and worst of all, sometimes we have to deal with major flaws in the process design.
What’s a system integrator to do when they encounter a conflict between a process design that’s left to them and the practical operation of the control system? Unfortunately, the reality is there’s no one-size-fits-all solution. Sometimes, it means going back to the drawing board and redesigning the affected parts of the process, like Chris mentioned, and other times it’s up to the system integrator to bridge the gap and modify the control system in the field to work around the blind spot in the original design.
System integrator modifying a control system
Tom: I’d like to discuss a case study in automation implementation where a system integrator was tasked with modifying a control system in the field to work around a blind spot in the original process design. Here’s a quick introduction of the high-level process. It was a pilot plant for a large pharmaceutical company, so you can imagine a lot of clean rooms and a lot of stainless steel, like depicted here. The part of the process of interest was the suite of reactor tanks. Each had a dedicated temperature control unit or TCU that took care of basic warming and cooling, but when extremely low temperatures were called for, like temperatures below negative 30 °C, the heat transfer fluid gets circulated through a liquid nitrogen or LN2 heat exchanger to get things really cold, up to -78 °C.
Here’s a simple diagram to illustrate what’s going on here. Starting from the left side yet the heat transfer fluid coming in from the supply, goes into a TCU pump which goes into the reactor tank jacket. That brings you all your heating and cooling, and then the heat transfer fluid goes back to the distribution through the return. This is the setup when we’re not thinking about LN2 cooling, but once an operator puts in a set point, something like -30 to -40 °C, what we’re seeing is everything here with the flow path with the LN2. This is the same diagram we just saw, but if you see below, we have the flow path that goes into the heat exchanger as well as some extra valves. Same thing, starting from the left, the heat transfer fluid coming in from supply and the pump, but now we have a path that goes downwards, and that’s where you reach these valves here. This TCU LN2 supply valve, and on the return side you’ll have this return valve as well. These open once you activate LN2 cooling
Then we get to the LN2 heat exchanger, which is where all that extreme cooling happens with LN2, and then finally we get back up to the top with the reactor tank jacket, and the amount of fluid that actually gets pushed down into the heat exchanger is controlled by this controller here at the top. The more that control valve is opened, the more fluid goes directly into the reactor tank jacket, and the more that’s closed the more it gets pushed into the LN2 heat exchanger.
This is the same diagram but we just added on the nitrogen flow path at the bottom here. Down at the bottom left you have the LN2 supply and the LN2 supply valve, so that valve opens up once LN2 cooling is activated. Next you have the LN2 control valve here. This valve gets modulated based on the amount of cooling we need, and that gets determined by the cascade control loop here. The temperature is coming out of the LN2 heat exchanger both on the nitrogen side on the top and on the heat transfer fluid side on the bottom.
Once the liquid nitrogen goes through the heat exchanger, it comes out as nitrogen gas and comes out to the exhaust. What’s the problem here? What we’re having going on was the system only worked for the colder TCU set points around -60 to 70 °C, but not at the warmer TCU set points around -30 to -40 °C. But what happened is we figured out the key flaw was we had that TCU control valve at the top of the screen we saw earlier, that was essentially acting like a bypass valve, so if there was the LN2 side, you had it very cold and you didn’t want something really cold coming into your actual jacket loop at the reactor side.
Then, the TCU control valve gets really driven to open up a lot because there’s that huge differential between the temperatures, and once that happens, all the flow is going from that TCU pump you saw and it goes straight into the reactor jacket and it doesn’t go down that path to the LN2 heat exchanger. What you ended up with is a low flow condition there, which eventually leads to freezing of the little amount of heat transfer fluid left in the exchanger, and once things start turning solid for a process like this, then you lose all ability to control the system. Up here at the top you see this TCU control valve, if it’s opening a lot more to allow more fluid to go directly to the reactor tank jacket, then most of the flow is going that way and we have very little flow that goes the downward path to the heat exchanger.
Eventually, that little amount of heat transfer fluid gets overwhelmed by all the liquid nitrogen in the heat exchanger causing tons of freezing down there. What we identified as the root cause for all this was the bypass valve was paired up with a piece of equipment that’s really sensitive to low flow rates, but the problem was we were at the end of the project here.
Things were almost all commissioned, and so the customer was coming to us and asking how do we solve this problem using automation? How do we solve this problem without changing anything in the actual process? Our approach was to look at that temperature differential between the LN2 and TCU sites. What was thence between those LN2 and TCU set points that was causing that TCU control valve opens so much?
What we first observed was that LN2 set point down at the bottom gets set to a negative -78 °C for the design engineers. It was fixed and it seems like, well, if you’re going to set a set point at the TCU side to something like -30 to -40 °C, you’re going to have this huge differential of 34 °C, so of course you’re going to be working at that TCU control valve really hard and opening it like crazy. What we found was we need to find a way to decrease that differential, and the way we thought about it first was let’s use a fixed offset between the two set points so the LN2 set point is something adjustable and it moves with the TCU set point.
Let’s say a set point opposite 5 °C worked for a given TCU, so if the operator sets the TCU setpoint to something like -50 °C, for example, then what we’re going to do on the automation side is we’re going to send it a set point of -55 °C to the LN2 side. All right, so here is a diagram to explain what I’m talking about here. First I just want to clarify what we’re talking about when we say the TCU set point. What I mean here is the set point for the temperature of the heat transfer fluid that’s about to enter the reactor tank jacket. And when I say LN2 set point, it’s actually a bit of a misnomer because what I mean is not the temperature of the LN2 but the temperature of the heat transfer fluid as it exits the LN2 heat exchanger.
Once we implemented the set point offset, keeping the LN2 set point a lot closer to the TCU set point, so the offset was much smaller, what we found was the TCU control valve didn’t have to work so hard, didn’t have to open up so much. Most of the time it was closed and it allowed almost all the flow to go straight down to the LN2 heat exchanger and we avoided that whole situation with the low flow and the freezing.
Everything was great, except when we went back to testing with the colder set points like -60 to -70 °C. We found we’re not able to actually reach set point anymore. We observed the colder TCU set points required an even colder LN2 set point.
Maybe at -34 °C, that offset of 5 °C worked really well, but once we got up to -60 to -70 °C, we need an offset of 8 or 9 degrees, so the LN2 was much colder. What we found was the fixed set point offset was too limiting, wasn’t able to account for this other factor.
On the one hand, you had that warm TCU set point scenario we talked about where if the offset between the TCU and LN2 sides is too big, then we have all the flow going in the direction straight into the reactor tank jacket, not enough flow going into the heat exchanger, and we got all this freezing. But on the other hand, if that offset is not big enough, then we have the temperature down at the LN2 side is not cold enough to actually get us to reach set point when we get into the reactor tank jacket.
Seeing what the fixed offset model was missing was it wasn’t varied based on the value of the TCU setpoint, so what we started wondering was, does the set point offset vary constantly with TCU setpoint? Or in other words, does the set point offset vary linearly with TCU setpoint? When we applied a linear model, we found we were able to reach and maintain control at both the warmer and colder TCU set points, but for the TCU set points in between we’d end up with a low flow condition, freezing again. Based on this and the data we were seeing, it seemed like perhaps it was the rate of set point offset change was varying constantly with TCU set point, or in other words, perhaps the set point offset varied quadratically with TCU set point. When we applied the quadratic model, we found we were successful, we were able to control temperature across the entire set point range.
What we had going on was for the TCU control off the top, we were making sure it was more closed, it wasn’t opening too much, so in order to do that you had to make sure your offset between the TCU and LN2 side wasn’t too big.
This kept all the flow going down into the heat exchanger. At the same time, you had to make sure your set point offset was big enough so you were cold enough on the LN2 side to actually reach set point on the TCU side.
Here’s a little conceptual graph illustrating the different methods of set point offset tracking we used to model that relationship.
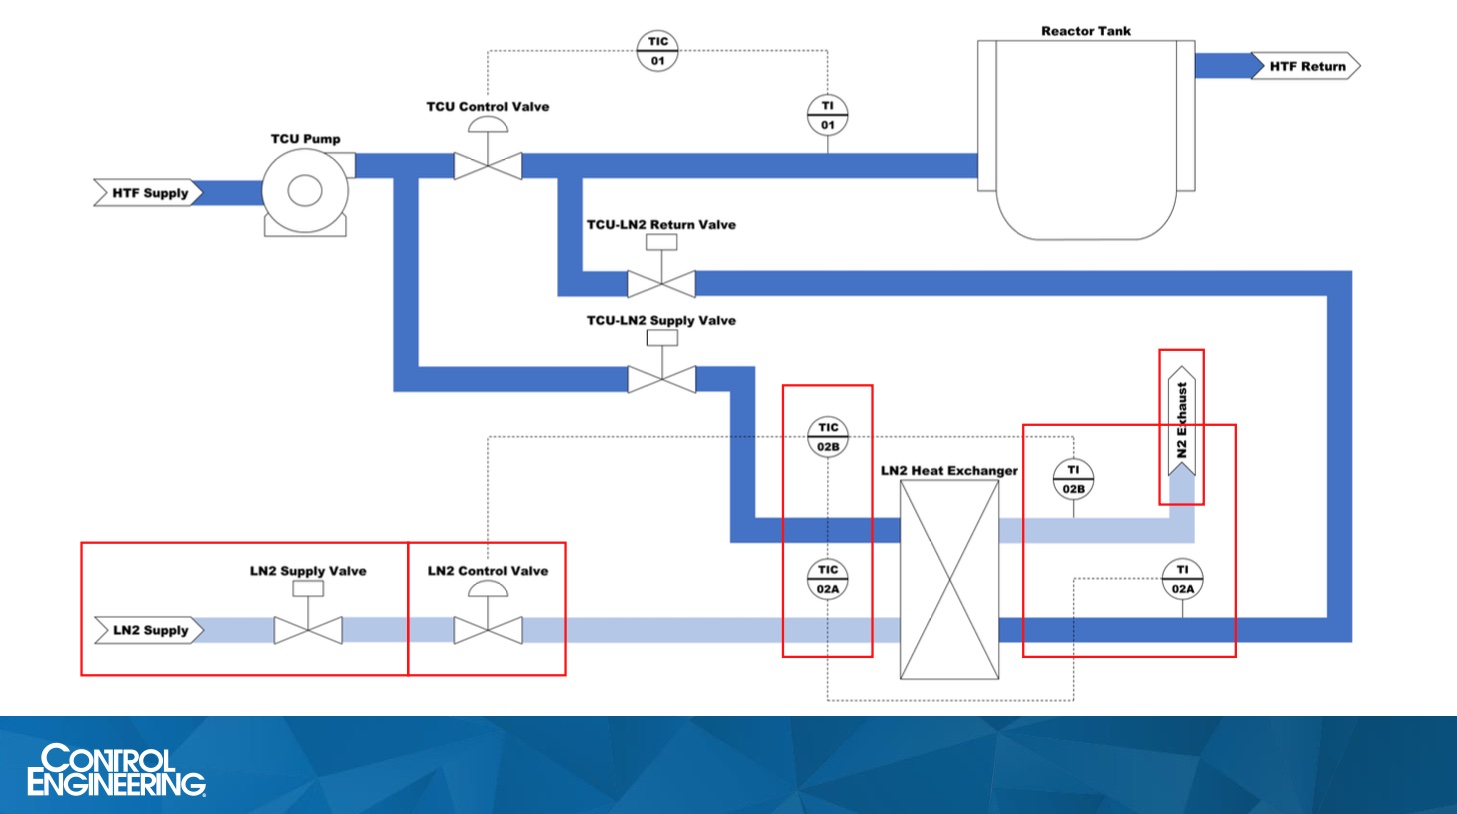
Figure 1: The control system case study highlighted in the Aug. 16 webcast involved a great deal of trial and error and learning what worked and what didn’t based on the temperature extremes involved. Courtesy: CFE Media and Technology, Applied Manufacturing Technologies, E Tech Group
The highlighted region represents the Goldilocks Zone in which temperature control is actually possible. In the area above the highlighted region, that’s where the LN2 set point was just too cold, that offset was too big, and so we’re seeing all of the low flow condition and the freezing happening. And in the area below the Goldilocks Zone, what we were seeing was we just couldn’t actually reach set point at the TCU. We weren’t getting enough cooling. The offset was too small. If we take a look at the fixed offset method that’s there, blue, it seemed really to perform well in the warmer TCU set point range, but we noticed at the colder TCU set points, the insufficient cooling to actually reach set point. When you take a look at the red, the linear offset method, that worked well at the warmest and the coldest TCU temperature set points, but in that middle range the heat transfer fluid would eventually freeze.
We couldn’t really reach a stable condition, and ultimately the quadratic offset method you see in black, that’s what performed the best. It allowed for TCU to control temperature across all set points, across the entire LN2 set point range. At the end of the project I feel like we’re able to build a lot of increased flexibility and functionality into the control system to patch around that design hole, but at what cost?
It took a lot of testing, weeks and weeks of testing to figure out all this data and to figure out what model worked best, and there was a lot of delays in schedule. We were the main focus of the whole project because we were holding everything up, and so things got pushed out a lot and we spent a lot of resources, both engineering and management resources, as well as a lot of LN2. What were our main takeaways from all of this? I think what we really learned was that thorough initial design and investigation is key.
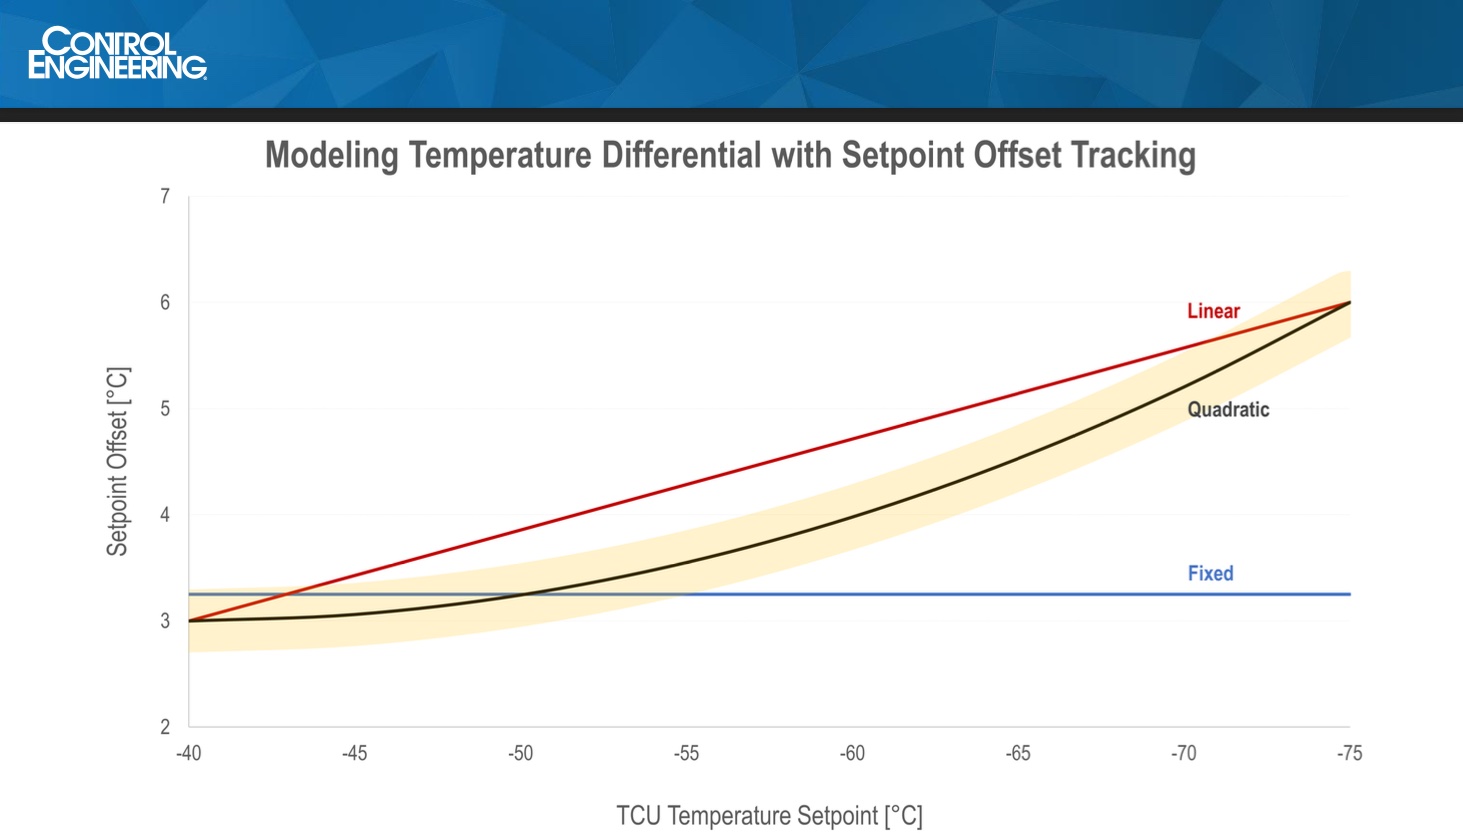
Figure 2: For the project, the quadratic model was the most successful in controlling temperature across the entire set point range. Courtesy: CFE Media and Technology, Applied Manufacturing Technologies, E Tech Group
It helps avoid those scheduled delays and that frenzied rush at the end fix everything. That saves a ton of money, time and headaches. We also learned it’s important to invite the integrator or the automation team into the conversation early on in the design phase. Essentially, that proves the ineffectiveness of that initial design and investigation phase.
Integrators have seen a lot and likely seen a similar process from other plants. The last thing we learned was automation can do a lot, but it can’t fix everything. In this case, I would say it worked out well in the end. Automation isn’t always able to fix the shortcomings in design. Sometimes it’s more of a bandage than a real fix, but the earlier automation is brought in, the more effective automation can be and the more likely the end user will have a system they’re happy with.
Edited by Chris Vavra, web content manager, CFE Media and Technology, cvavra@cfemedia.com.
Do you have experience and expertise with the topics mentioned in this content? You should consider contributing to our CFE Media editorial team and getting the recognition you and your company deserve. Click here to start this process.